The metrics dashboard is a great way to understand how Vivi is used in your organisation.
Part of the metrics screen
To view the metrics, click on the "Metrics" link within Vivi Central.
The following metrics are available:
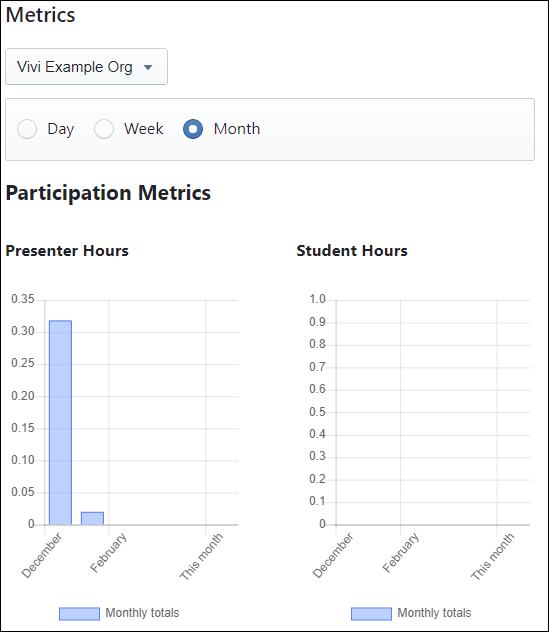
- Participation metrics
- Presenter hours
- Student hours
- Top teacher users
- Top student users
- Top 10 rooms
- Bottom 10 rooms
- Engagement metrics
- Share student (where a student shares their screen)
- Screenshot taken
- Direct video play
- Share student link
Metrics can be filtered by organisation, day, week and month.
A ranking leader board can also be created for the following statistics:
- Room stream time
- Presenter stream time
- Student stream time
To view rankings:
- Under the "Metrics" link in Vivi Central, select the "Rankings" link.
- Select the organisation.
- Select the timeframe, metric to rank and the order (ascending or descending).
The ranking leader board will be generated automatically.
Providing Access to Metrics
You may wish to provide access to Metrics to other business users in your organisation. Simply add the "E-Learning Admin" role to their user account and they will be able to log in and see Metrics, but without access to the Vivi administration features.
...